All work

Business Intelligence & Data Quality

Complete

Nova Scotia Housing Affordability & Rental Pressure Monitor

Did Halifax rent rise faster than people’s ability to pay it — and did supply have anything to do with it?

Role
Sole analyst & developer
Timeline
May–Aug 2026
Category
Business Intelligence & Data Quality
Stakeholder
Personal project (framed for a housing policy or planning reader)
Rent outpaced income, 2019–2024
19 ppRent outpaced income, 2019–2024Halifax two-bedroom rent rose 42% while Nova Scotia median after-tax income rose 23%.
Official sources in one model
5Official sources in one modelCMHC Rental Market Survey plus four Statistics Canada tables, conformed into a single star schema.
Suppressed observations preserved
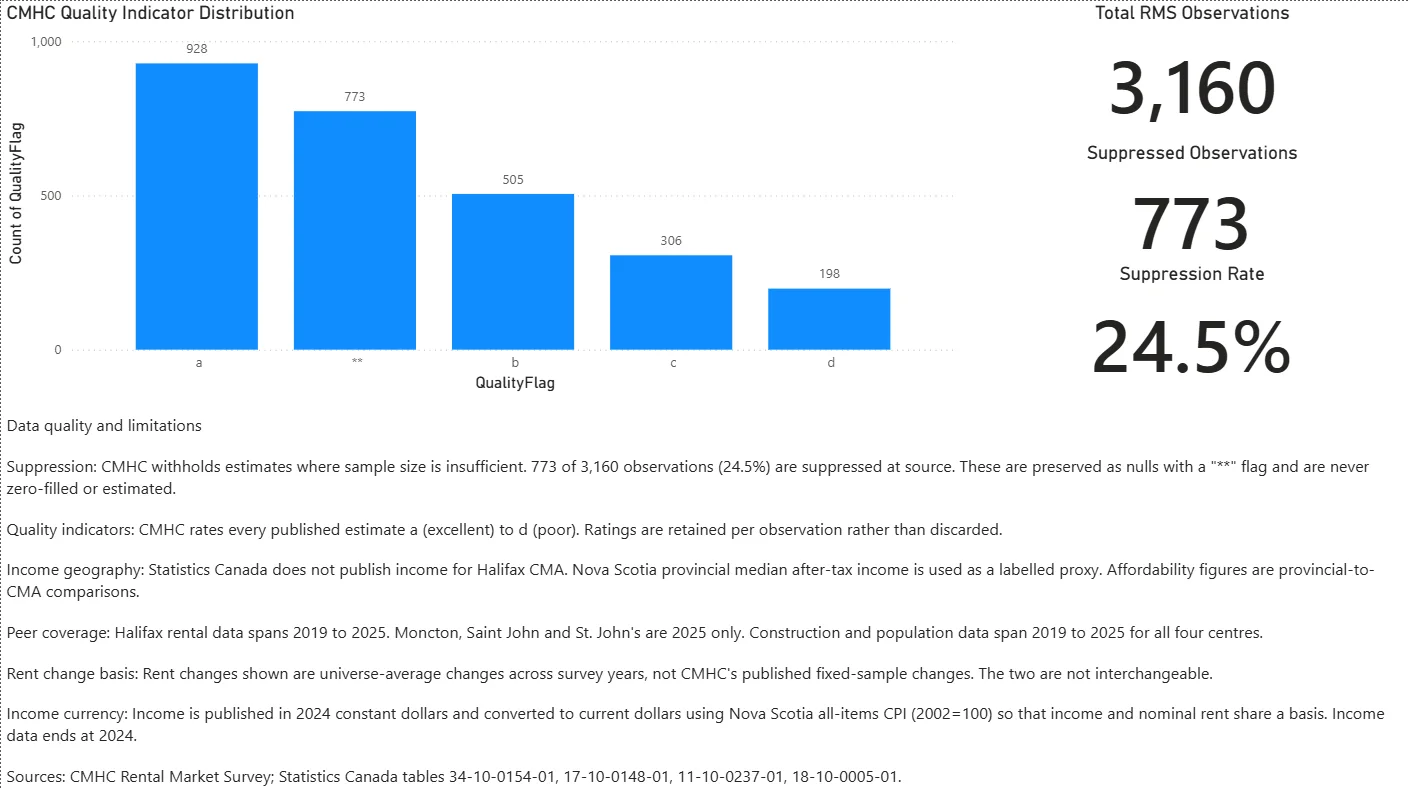
24.5%Suppressed observations preserved773 of 3,160 observations are withheld at source; they are kept as flagged nulls, never zero-filled or imputed.
  • Power BI
  • Power Query (M)
  • DAX
  • Excel
  • Git

In 30 seconds

A Power BI report built entirely from five official CMHC and Statistics Canada sources, with every published number traceable to a source file and a documented transformation. Includes a custom Power Query parser for CMHC’s crosstab workbooks and a documented data-quality regime.

Rent outpaced income, 2019–2024
19 ppRent outpaced income, 2019–2024
Official sources in one model
5Official sources in one model
Suppressed observations preserved
24.5%Suppressed observations preserved

Context

Halifax has been visibly expensive for several years. The interesting question is not whether rent went up, but whether it went up faster than people’s ability to pay it — and whether housing supply had anything to do with it.

Answering that needs four things measured against each other: rent, income, population and construction. No single dataset carries all four. They come from five separate official publications, at different frequencies, on different geographies, in different dollar bases, with different suppression conventions. Getting them into one model where a comparison is actually valid is most of the work.

This is a personal project. The stakeholder is framed, not real, so recommendations are written as what the analysis suggests rather than as policy advice.

Data

Source
CMHC Rental Market Survey (Excel workbooks) and four Statistics Canada tables — all official, public, and licensed for reuse
Time period
Halifax CMA 2019–2025; Moncton, Saint John and St. John’s 2025 (construction and population 2019–2025 for all four)
Records
3,160 CMHC observations plus roughly 6,800 rows across the Statistics Canada sources
Granularity
One observation per zone × bedroom type × reference date × metric

Data quality & handling

  • 773 of 3,160 observations (24.5%) are suppressed at source. They are preserved as nulls carrying a `**` flag — never zero-filled, interpolated or estimated. Where data does not exist, the report shows a gap.
  • Suppression is non-random: it clusters where samples are thin, so row units, studios, three-bedroom units, zone-level cells and smaller centres are less visible.
  • CMHC quality ratings (a excellent → d poor) are retained per observation, in a field separate from change-significance markers, matching CMHC’s own two-heading legend.
  • Income is published in 2024 constant dollars while rent is nominal. Income is converted to current dollars using the Nova Scotia all-items CPI (2002=100) anchored on the 2024 index value of 164.2 — provincial CPI to match the provincial income series.
  • No Halifax CMA income series exists, so Nova Scotia provincial median after-tax income is used as an explicitly labelled proxy on every affordability figure.

Data dictionary

TableDescriptionSize
CMHC RMSRent, vacancy, turnover and universe by zone and bedroom type.3,160 rows
StatCan 34-10-0154Housing starts, completions and under construction, monthly.6,750 rows
StatCan 17-10-0148Population estimates, July 1, annual.35 rows
StatCan 11-10-0237Income distribution, Nova Scotia.6 rows
StatCan 18-10-0005Consumer Price Index, Nova Scotia all-items.7 rows

Analytical approach

Raw source files are never modified — all cleaning happens in Power Query, so the pipeline reproduces from the original workbooks.

  1. Ingest CMHC workbooks + StatCan tables
  2. Parse via fnParseRMS (manifest-driven)
  3. Conform geography across sources
  4. Rebase income to current dollars (CPI)
  5. Load star schema
  6. DAX measure layer
  7. Six-page Power BI report

The report

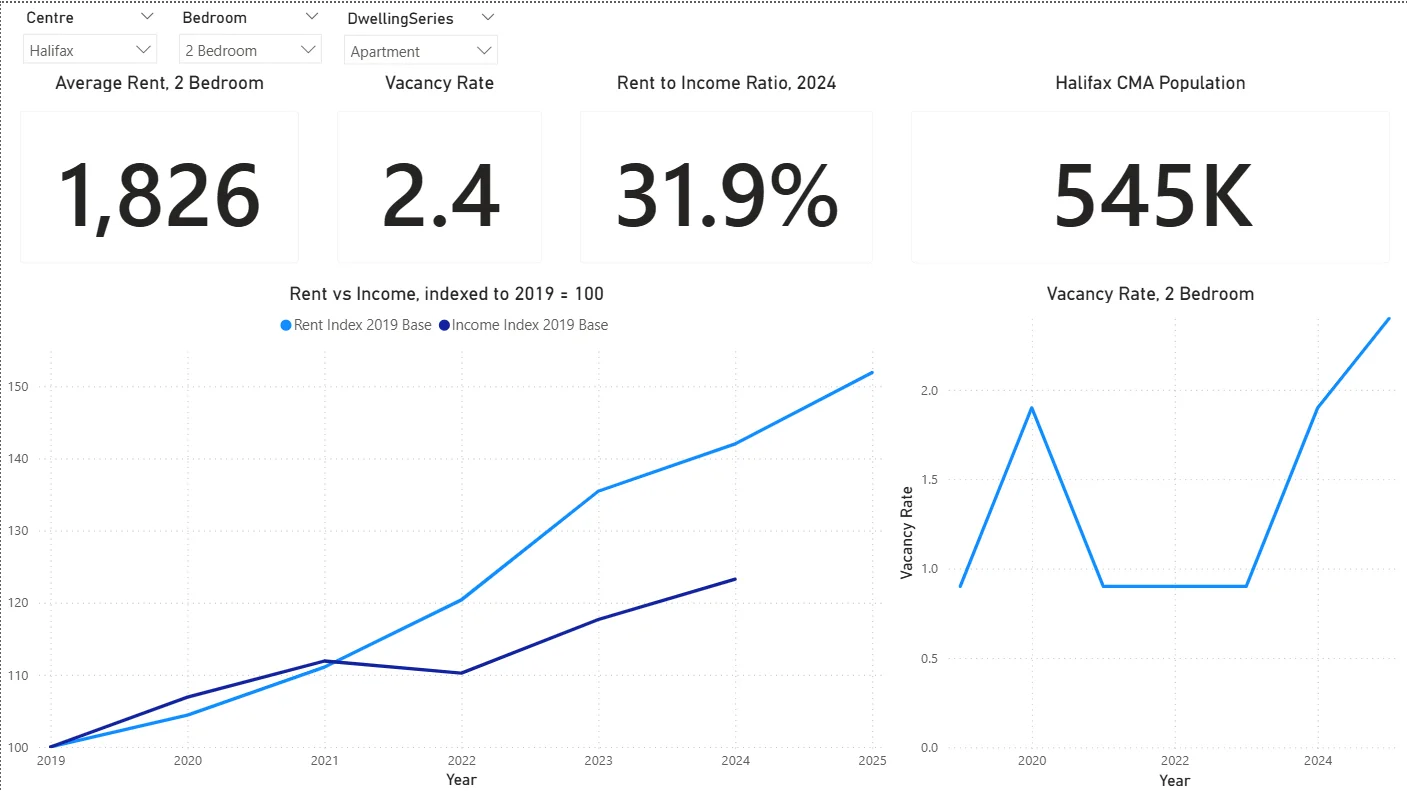
Power BI executive page showing average two-bedroom rent of $1,826, a 2.4% vacancy rate, a 31.9% rent-to-income ratio, Halifax CMA population of 545K, and a chart of rent versus income indexed to 2019 = 100 in which the two lines diverge after 2021.
The Executive page: headline measures and the indexed rent-versus-income divergence.
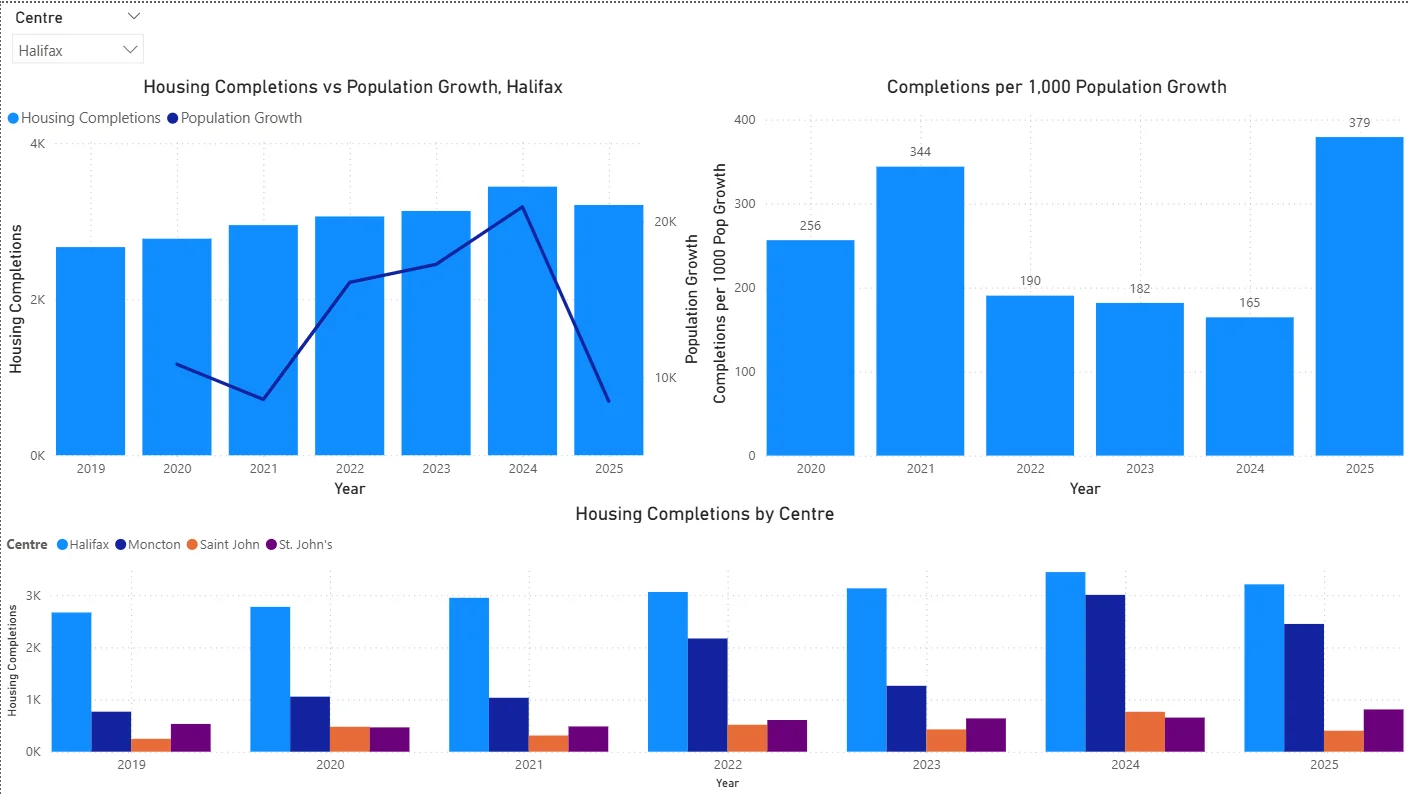
Power BI page showing Halifax housing completions against population growth, completions per 1,000 population growth by year, and completions by centre for Halifax, Moncton, Saint John and St. John’s.
The Housing Supply page: completions against population growth, and the completions-per-1,000 ratio.
Power BI data quality page showing CMHC quality-indicator distribution, 3,160 total observations, 773 suppressed, a 24.5% suppression rate, and written limitations.
The Data Quality page — suppression counts, quality-flag distribution and limitations stated on the report itself.

Findings

Rent outpaced income by roughly 19 percentage points in five years.

Between 2019 and 2024, average two-bedroom rent in Halifax CMA rose 42% while Nova Scotia median after-tax income rose 23%. Indexed to a 2019 base the two lines track each other until 2021, then diverge sharply. By October 2025 rent reached $1,826, up 51.9% from 2019.

Why it matters. It reframes the question from “is rent high?” to “is rent rising faster than the ability to pay it?” — which is the version a planning or policy reader can act on.

Caveat. Income is Nova Scotia provincial median after-tax income used as a labelled proxy: Statistics Canada does not publish income for Halifax CMA. Income is also rebased from 2024 constant to current dollars via provincial CPI before any comparison.

Supply grew. Demand grew about three times faster.

Halifax completions rose from 2,668 in 2019 to 3,443 in 2024 (+29%), but annual population growth rose from 10,828 to 20,919 (+93%) over a comparable window. Completions per 1,000 new residents fell from 344 in 2021 to 165 in 2024, then jumped to 379 in 2025 when population growth collapsed to 8,462.

Why it matters. The ratio moved before vacancy did, which makes it a useful leading indicator — and it shows the 2025 easing came from the demand side, not from building more.

Caveat. This is a descriptive association across three independent sources, not a causal claim. Completions themselves actually fell 7% in 2025.

Housing completions per 1,000 population growth, Halifax

Housing completions per 1,000 population growth, Halifax
YearCompletions per 1,000 population growth
2020256
2021344
2022190
2023182
2024165
2025379

Recreated as native SVG from the project’s output (page-03.png data labels).

Vacancy sat at 0.9% for four consecutive years.

From 2020 through 2023 the two-bedroom vacancy rate in Halifax held at 0.9% — about as tight as a rental market gets — before loosening to 1.9% in 2024 and 2.4% in 2025.

Why it matters. Four years at 0.9% is the mechanism behind the rent series: in a market that tight, price pressure has nowhere to go but up.

Caveat. CMHC surveys in the first two weeks of October only, and vacancy is seasonal in a university city.

A silent parser defect was destroying 49 of 360 observations before it was caught.

An early version of the parser classified each spreadsheet column by inspecting a single cell. Where that cell was suppressed, the whole column was misclassified and its values were diverted into the quality-flag field. Nothing errored and the row count was correct. Comparing three sheets from one workbook isolated it: the pattern of loss matched the pattern of suppression exactly.

Why it matters. Uncorrected, the Halifax row-rent series would have shipped completely empty while the apartment series looked perfect. Row-count checks would never have caught it — the lesson is to validate values, not just shapes.

Caveat. The fix classifies on the whole column and parses numbers with the en-CA culture. Verified across all 3,160 rows: the quality-flag field now contains only null, **, a, b, c and d.

CMHC quality-indicator distribution (3,160 observations)

CMHC quality-indicator distribution (3,160 observations)
Quality flagObservations
a928
**773
b505
c306
d198

Recreated as native SVG from the project’s output (page-06.png data labels).

Recommendations

Monitor completions per 1,000 population growth as a leading indicator.

What the analysis suggests
Evidence
In this dataset the ratio moved before vacancy did — falling through 2022–2024 and recovering in 2025 alongside vacancy loosening.
Expected benefit
An earlier signal of rental pressure than vacancy alone provides.
Risk
Directional only — it is not a target, and it should be read as a ratio rather than either term alone.

Do not read the 2025 easing as a supply success.

What the analysis suggests
Evidence
Completions fell 7% that year (3,443 → 3,208). The ratio improved because population growth fell 60% (20,919 → 8,462).
Expected benefit
Prevents attributing a demand-side change to a supply-side intervention.

Watch three-bedroom affordability specifically.

What the analysis suggests
Evidence
At 40.6% of provincial median after-tax income in 2024, family-sized units carry substantially more pressure than smaller units.
Expected benefit
Targets the segment under the most pressure.
Risk
That segment is also more suppressed in the source data, so it is less visible.

Validation

  • Value-level verification against source workbooks

    Measures were checked against the original CMHC workbooks at every ingestion stage, cell by cell rather than by row count. This is what surfaced the parser defect: the row count was correct throughout.

  • Natural-experiment diagnosis

    The defect was isolated by comparing three sheets from one workbook — one where the sampled cell was suppressed in 3 of 10 columns (22 of 120 observations lost), one suppressed in all 10 (27 of 120 lost), and one with values throughout (0 lost). The pattern of loss matched the pattern of suppression exactly.

  • Flag-domain check

    After the fix, all 3,160 rows were checked: the quality-flag field contains only null, `**`, a, b, c and d, with no stray numeric values anywhere.

  • Published totals never reconstructed

    CMHC’s CMA figures are survey-weighted. An unweighted average of the eleven Halifax zones gives 1,779 for a two-bedroom in 2025; the published figure is 1,826. The report uses the published row, and zone-detail totals are switched off so the wrong number can never be displayed.

Limitations

  • The CMHC survey frame is narrow: it covers privately initiated purpose-built structures with three or more rental units, excluding rented houses, basement suites, individually rented condos, and social and affordable housing.
  • Rents are rents paid, not asking rents — they include sitting tenants under rent-cap protection, so the report understates pressure precisely when pressure is highest.
  • Income geography is a labelled proxy: Nova Scotia provincial income against Halifax CMA rent, because no CMA-level income series is published.
  • Peer coverage is asymmetric — Halifax rental data spans seven years, the three comparison centres are 2025 only. Population and construction span 2019–2025 for all four.
  • Rent changes shown are universe-average changes across editions, not CMHC’s published fixed-sample change. The two are not interchangeable.
  • Suppression is extensive and non-random (24.5%), clustering in row units, studios, three-bedroom units and smaller centres.
  • Income data ends at 2024, so affordability has no 2025 value. Causation is never claimed.

My contribution

  • Built the custom Power Query M parser (fnParseRMS) that normalises CMHC’s two-row-header crosstab workbooks, driven by a manifest so a new edition is one row rather than one query.
  • Designed the star schema: four conformed dimensions, separate fact tables per metric, geography conformed across three different spellings of Halifax.
  • Diagnosed and fixed the single-cell column-classification defect, then verified the fix across all 3,160 observations.
  • Authored the DAX measure layer, the six-page report, and the documentation set (decision log, data dictionary, source register, limitations).

Technical appendix

The parser: fnParseRMS and a manifest

CMHC publishes the Rental Market Survey as Excel workbooks of 34 tables. The needed sheets are crosstabs with a two-row header (bedroom type, then survey date), quality letters in unlabelled columns beside their values, `**` for suppressed cells, and change-significance arrows in a third position on vacancy sheets. None of it survives a naive import. fnParseRMS takes a file path and sheet name and returns a normalised seven-column table: zone, bedroom, reference date, value, quality flag, change significance, geography level. Rather than invoking it sheet by sheet, a manifest control table lists edition year, centre, file, sheet, metric, dwelling series and value kind; one Table.AddColumn call invokes the function across all 32 manifest rows. Adding a new edition is one manifest row, not one query.

The bug that nearly shipped

The early parser classified each column by looking at one cell — the first data row, Zone 1 Peninsula (South). Where Zone 1 happened to be suppressed, the entire column was typed as a flag column, no column remained typed as a value column, and the pivot assigned the actual numbers to the quality-flag field for every zone in that column. Nothing failed; affected rows looked like ordinary suppressed cells. The fix classifies on the whole column: a column is a value column if any cell parses as a number, and a flag column only if every non-empty cell is a known marker. The number parse also needed the en-CA culture, since values like 1,308 fail an uncultured parse.

Model design: why separate fact tables

A star schema with four conformed dimensions and separate fact tables per metric. Rent is in dollars, vacancy and turnover are percentages, universe is a unit count — in a single tall fact, SUM over the value column adds dollars to percentages and returns a plausible-looking number with no error raised. A wide fact with four value columns was considered (the grain is identical) but loses here, because each observation needs both a quality flag and a change-significance marker, which in a wide design means eight sparse flag columns.

Measure layer and report structure

23 DAX measures cover rent, vacancy, turnover and universe at both CMA and zone grain, plus CPI-adjusted income, affordability ratios, year-over-year change, population growth and completions per 1,000 population growth. The report is six pages: Executive, Rental Market, Housing Supply, Affordability, Regional Comparison and Data Quality. Value columns are set to Do Not Summarize and hidden, so only explicit measures are exposed — a percentage can never be accidentally summed.

Geography: conformed names, not DGUID

Halifax appears as “Halifax, Nova Scotia” in construction, “Halifax (CMA), Nova Scotia” in population, and “Halifax CMA” in the rental survey. DGUID looked like the obvious join key until it turned out to be blank on the national aggregate rows, which would have silently dropped the Canada benchmark from every join. It is retained as an attribute and the join runs on a conformed name.