Available for data & analytics opportunities

Hetang Patel

Data Analyst building reliable analytics systems and decision-ready insights.

I transform complex data into trusted models, interactive dashboards, and clear recommendations using SQL, Power BI, Python, and modern data platforms.

Halifax, Nova Scotia · Open to opportunities across Canada

  • SQL
  • Power BI
  • Python
  • dbt
  • Snowflake

An illustration of the analytics process: raw data points are organized into a modelled table, analysed into a chart, and a highlighted trend leads to a decision supported by evidence.

Rent outpaced income, 2019–2024
19 ppRent outpaced income, 2019–2024
Transit records analysed
663K+Transit records analysed
Lower forecast error than baseline
42%Lower forecast error than baseline
Cross-functional team led
10Cross-functional team led
Historical race laps modelled
86K+Historical race laps modelled

Selected case studies

Analysis that leads somewhere

Each project begins with a practical question, builds a reliable analytical foundation, and ends with an insight, recommendation, or working product.

01Business Intelligence & Data Quality

Nova Scotia Housing Affordability & Rental Pressure Monitor

Did Halifax rent rise faster than people’s ability to pay it — and did supply have anything to do with it?

A Power BI report built entirely from five official CMHC and Statistics Canada sources, with every published number traceable to a source file and a documented transformation. Includes a custom Power Query parser for CMHC’s crosstab workbooks and a documented data-quality regime.

Rent outpaced income, 2019–2024
19 ppRent outpaced income, 2019–2024
Official sources in one model
5Official sources in one model
Suppressed observations preserved
24.5%Suppressed observations preserved
  • Power BI
  • Power Query (M)
  • DAX
  • Excel
  • Git
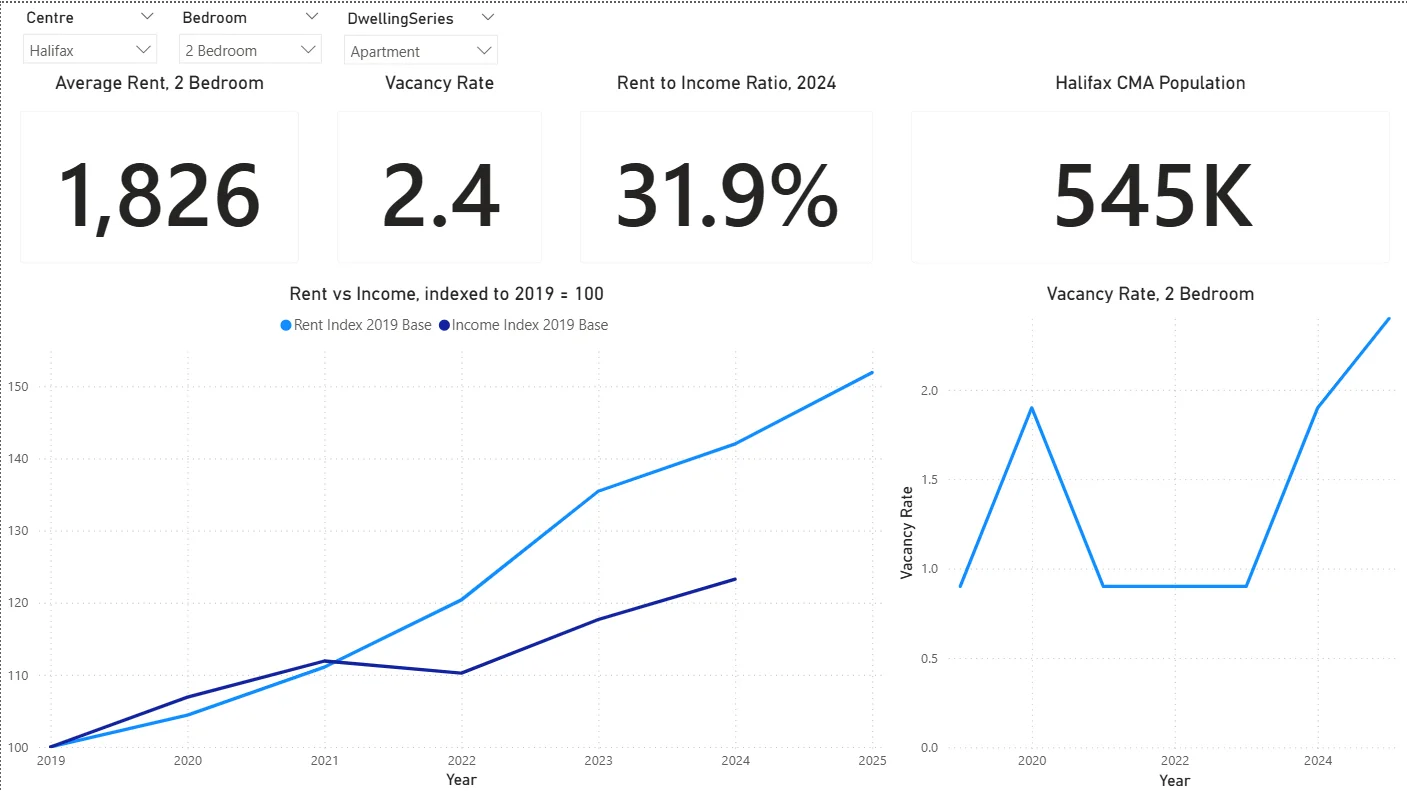
Power BI executive page showing average two-bedroom rent of $1,826, a 2.4% vacancy rate, a 31.9% rent-to-income ratio, Halifax CMA population of 545K, and a chart of rent versus income indexed to 2019 = 100 in which the two lines diverge after 2021.
The Executive page: headline measures and the indexed rent-versus-income divergence.

02Spatial & Operational Analytics

Halifax Transit Service Equity Analysis

Where is Halifax’s transit network leaving riders underserved?

I transformed 663,788 public-transit records into a normalized PostgreSQL + PostGIS spatial database and an interactive dashboard, surfacing gaps in route access, stop connectivity, and service concentration across Halifax.

Transit records analysed
663,788Transit records analysed
Stops served by a single route
41%Stops served by a single route
Query time, down from 4s+
<1sQuery time, down from 4s+
  • SQL
  • PostgreSQL
  • PostGIS
  • Python
  • Streamlit
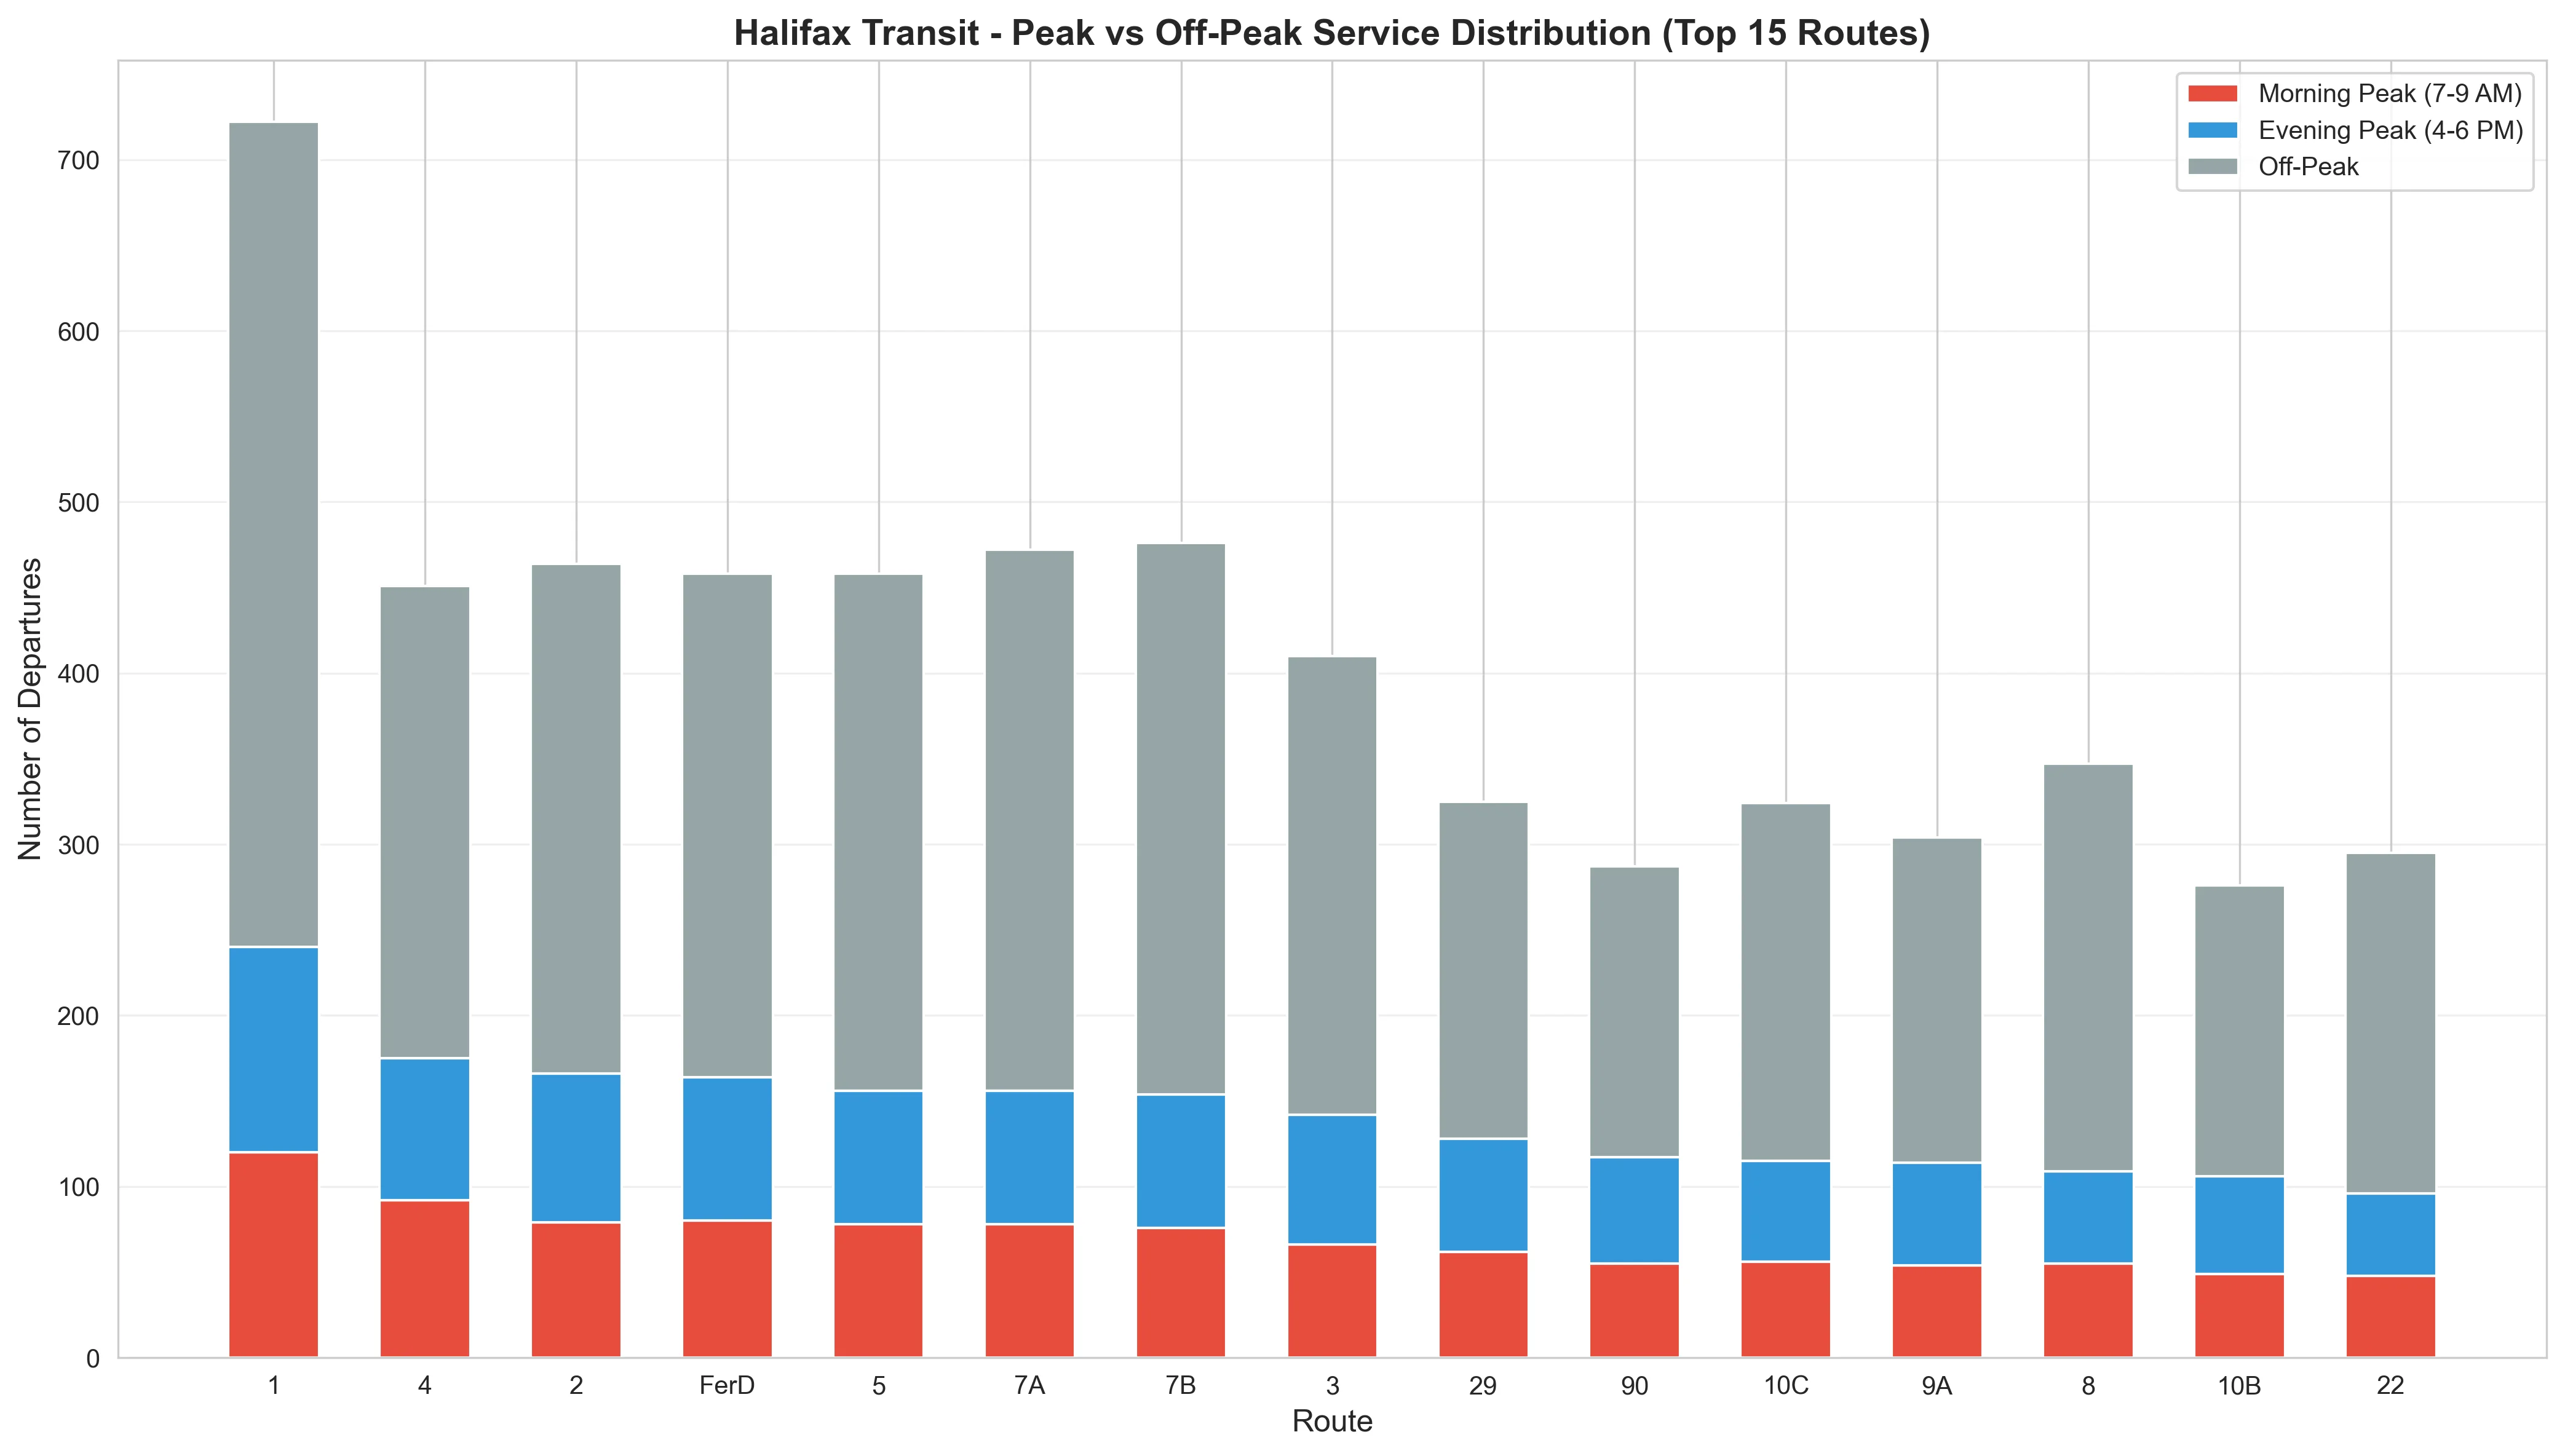
Stacked bar chart of the top 15 Halifax Transit routes, splitting each route’s departures into morning peak (7–9 AM), evening peak (4–6 PM) and off-peak service.
Peak versus off-peak service distribution across the fifteen busiest routes — Route 1 carries roughly 50% more departures than any other.

03Causal Inference & Analytics Engineering

F1 Regulation Impact Analyzer

Did Formula 1’s 2022 regulations actually make the competition closer?

I built a Snowflake + dbt analytics warehouse and a causal-inference framework to separate the effect of the 2022 rule change from existing team-performance trends, then forecast the 2026 regulation reset with a walk-forward model.

Estimated regulation effect
+0.068Estimated regulation effect
Lower forecast error vs baseline
42%Lower forecast error vs baseline
Seasons modelled
2019–2026Seasons modelled
  • Snowflake
  • dbt
  • Power BI
  • Python
  • statsmodels
  • scikit-learn
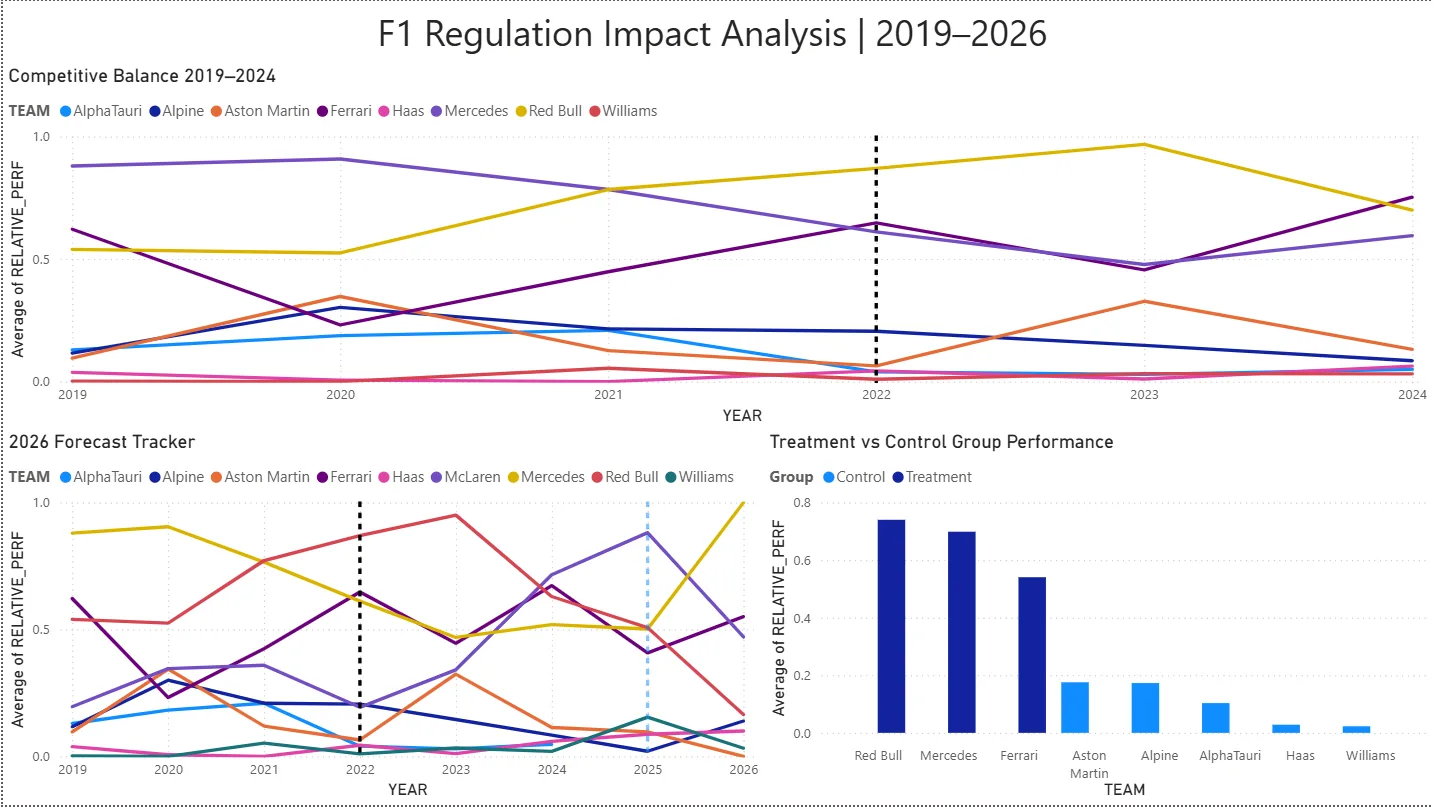
Power BI dashboard showing competitive balance, treatment vs control, and the 2026 forecast tracker.
The three-view Power BI dashboard connected live to Snowflake mart tables.

04Analytics Platform & Team Leadership

BIOMEX Genomics Analytics Platform

How can researchers run complex genomic analysis without depending on manual engineering support?

I led a 10-person cross-functional team rebuilding a legacy desktop bioinformatics workflow into a self-service web platform for a Dalhousie faculty researcher, delivering a working DESeq2 differential-expression pipeline as a validated proof of concept.

Cross-functional team led
10Cross-functional team led
Samples per run (target capacity)
60–90KSamples per run (target capacity)
Analysis pipeline delivered
DESeq2Analysis pipeline delivered
  • React
  • Firebase
  • R
  • R Plumber
  • DESeq2

More analytical work

Applied machine learning & deployment

Two additional projects that pair statistical modelling with production delivery.

Capabilities

From raw data to a defensible decision

Four areas of practice, each grounded in the projects that demonstrate it.

Analytics & business intelligence

I define useful metrics, investigate performance, and build dashboards that make important changes visible.

  • SQL
  • Power BI
  • Streamlit
  • Data visualization

Evidence: Halifax Transit, F1 Regulation Impact

Analytics engineering

I structure raw information into tested, documented, and reusable analytical models.

  • dbt
  • Snowflake
  • PostgreSQL
  • Data modelling
  • ETL / ELT

Evidence: F1 Regulation Impact, Halifax Transit

Statistical analysis & forecasting

I use statistical methods to test assumptions, estimate effects, and evaluate predictions against meaningful baselines.

  • Hypothesis testing
  • Causal inference
  • Ridge regression
  • XGBoost

Evidence: F1 Regulation Impact, F1 Strategy Simulation

Stakeholder & team delivery

I translate technical requirements into scoped work, coordinate contributors, and communicate findings to technical and non-technical audiences.

  • Agile
  • Scrum
  • Jira
  • Documentation
  • Project leadership

Evidence: BIOMEX

Experience

Formal roles & team delivery

  • Sep 2025Dec 2025

    Project Lead

    BIOMEX — Dalhousie University

    Led a 10-person cross-functional team rebuilding a legacy desktop bioinformatics workflow as a self-service web platform for a faculty stakeholder, delivering a working DESeq2 pipeline as proof of concept.

    • React
    • Firebase
    • R
    • R Plumber
    • DESeq2
    • Agile
  • Jan 2025Apr 2025

    Software Developer

    Radius Research & Development — Dalhousie University

    Improved sprint delivery and onboarding by introducing structured Scrum ceremonies, Jira tracking, and GitLab CI automation, and by authoring onboarding documentation.

    • Scrum
    • Jira
    • GitLab CI
    • Git
Full experience

About

Curious about the question behind the metric

I’m a Halifax-based data analyst with a computer-science background and an interest in building analytical systems that are both technically reliable and easy to understand.

My work spans business intelligence, analytics engineering, spatial analysis, forecasting, and causal inference. I enjoy projects where the data is imperfect, the question needs careful thinking, and the result has to be understood by someone who didn’t build it.

I completed my Bachelor of Computer Science at Dalhousie University and hold the Google Advanced Data Analytics Professional Certificate. Outside conventional analytics problems, I use Formula 1 as a testing ground for forecasting, strategy, and the effect of major rule changes.

Contact

Have a data problem worth investigating?

I’m exploring data analyst, business intelligence, and analytics engineering roles where I can help turn complex information into trusted decisions. Based in Halifax, Nova Scotia, and open to opportunities across Canada.